COPAS FP
Profiler Software (FlowPilot-Pro™)
This package seamlessly integrates all the features of ProfilerTM into the FlowPilot software suite.
Like most flow cytometer software, the standard FlowPilot software provides a single integrated signal measurement for each parameter of an object and these signals are used for analysis and sorting decisions. But most large objects are NOT homogeneous in terms of fluorescence or optical density … so we created “Profiler” software.
Profiler II takes data collection to the next level by simultaneously recording up to 8,000 data points per object for each of the four optical parameters: extinction and three fluorescence channels. The software then graphically and numerically displays variations of those signals along the length of an object as a succession of peaks and valleys that directly trace the fluorescence intensity and optical density of the object as it passes through the flow cell. The result is an “optical profile” of each object graphically mapping the location and intensity of all four optical parameters plus determining values for peak height, peak width, peak count and relative position – all of which can be used as sort criteria.
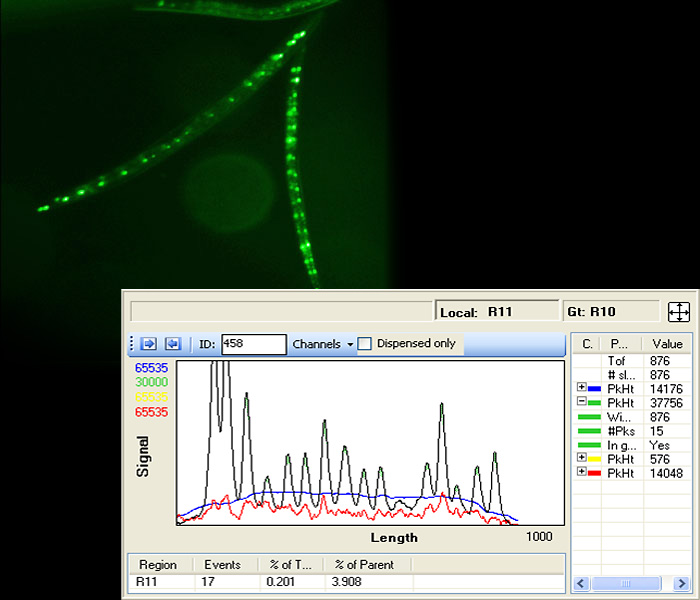
Fig 7 – Profiler™ Software
Digitizes optical density and fluorescence patterns along the axial length of the object as it passes through the flow cell. Example: Profiling GFP-expressing seam cells in nematodes. (Courtesy of Appleford at the Woolard lab, U. of Oxford.)
Another profiling feature is Partial Profiling. By zeroing in on one region of the profile, Partial Profiling allows you to strategically identify optical or fluorescence characteristics from that area alone. With Partial Profiling active, profile features (peak height, width or count) as well as integrated values over that limited portion are now analyzed and graphed as their own customized parameter (pp). Partial Profiling can be configured to analyze extinction and fluorescence measurements exclusively to the organism’s head, tail, middle, or end regions. For example, presence of greenpp[head] HEAD NEURONS vs redpp[center] OVARY regardless of any other green or red fluorescence in the animal). (*pp indicates partial profiling is active in the head area [head] or center of object [center])
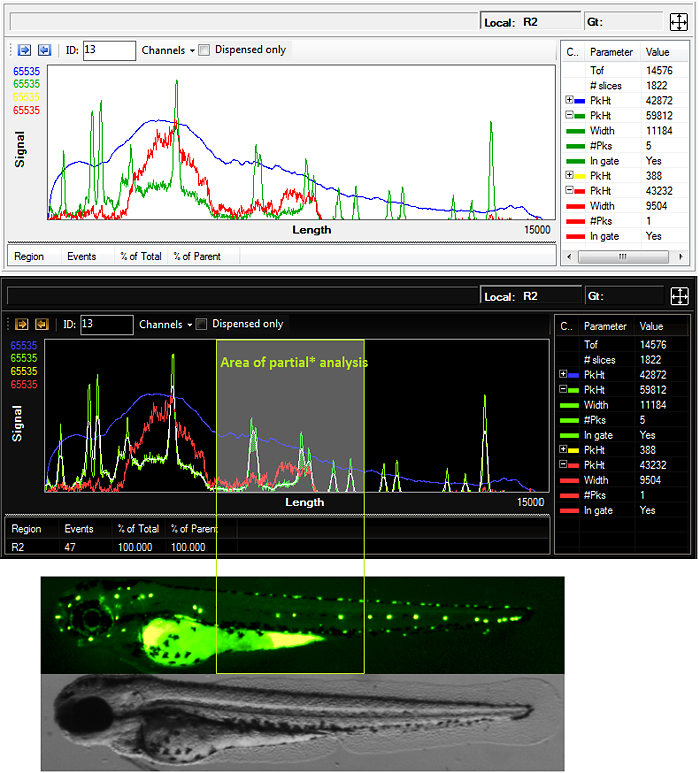
Fig 8 – Zebrafish Partial Profiles.